What is the Opportunity Score?
The Opportunity Score is a tool that helps (among other things) to estimate market opportunity, to prioritize efforts in product development and to conduct competitive analysis. It is part of the Opportunity-Driven Innovation framework created by Anthony W. Ulwick, that aims at “making innovation predictable”. This article focuses specifically on the Opportunity Score calculation. Bear in mind it is not a silver bullet, and if you want to use properly, you should probably read a bit more on the Opportunity-Driven Innovation process to get the whole picture. To help with that, I have included a few links in the “Further Reading” section at the end of the article.
Background
Ulwick’s work on Opportunity-Driven Innovation (ODI) is based on the idea that customers mainly pay to get a job-to-be-done. This means people do not actually care about tools, features or specs, what they care about is achieving a goal (this is nicely explained by Prof. Clayton Christensen in this video). If a product of service helps customers to achieve the goal (to get a job done), they will pay for it. Ulwick says that deeply understanding the customers’ job-to-be-done is necessary to predict whether a product will be successfull, that is, people will pay for it. The ODI framework is a systematic approach towards analyzing jobs-to-be-done to decide whether to invest on a certain design space, and how to prioritize such investment. Analyzing a job-to-be-done is usually the result of deep qualitative research with customers (e.g. interviews). BTW, according to Ulwick, jobs-to-be-done generally don’t change across time. This might be suggested by the example below.
The Opportunity Score
The main metric used in the ODI framework is the Opportunity Score. This is the result of an analysis of the gap between the importance that customers assign to the expected outcomes of a job-to-be-done, and how satisfied they are with their current solutions.
Once a job-to-be-done has been understood, it should be broken down the into smaller job steps, and for each step, a series of outcomes (as expected or desired by customers) should be enunciated. For instance, a job-to-be-done could be:
Surviving grad school.
And the steps and outcomes of this job-to-be-done and their outcomes could be:
| Job step | Outcomes |
|---|---|
| Complete academic duties | Writing papers |
| Getting submitted paper accepted | |
| Completing homework | |
| Passing exams | |
| Supervising undergrad students | |
| Daily activities | Getting out of bed |
| Having coffee | |
| Finding cheap food | |
| Taking time to relax | Discreet napping |
| Fleeing from meetings | |
| Hiding from professors |
Collecting the data
To obtain the Opportunity Score for each outcome, you first need to collect data from your customers about the desired outcomes. You should ask customers two questions:
- Importance: When [job step], how important is it to you that you are able to [outcome]? (1 to 5 scale, 1 = “Not at all important”, 5 = “Extremely important”)
- Satisfaction: When using [solution], how satisfied are you with your ability to [outcome]? (1 to 5 scale, 1 = “Not at all satisfied”, 5 = “Extremely satisfied”)
Where [solution] is the solution that the customer currently uses to get the job done.
Computing the score
This is pretty easy:
-
Compute the _percentage of respondents who answered 4 or 5__ to both importance (that is those who said the outcome is “Important” or “Extremely important”) and satisfaction (those who said they are “Satisfied” or “Extremely satisfied”).
-
Insert these percentages in the Opportunity Score formula:
OpScore = Importance + max(Importance - Satisfaction, 0)
I made up some answer values for the “surviving grad school” example:
| Outcomes | Importance (%==4 or 5) | Satisfaction (%==4 or 5) | OpScore |
| Passing exams | 8.57 | 1.43 | 15.71 |
| Finding cheap food | 7.59 | 4.14 | 11.03 |
| Hiding from professors | 9.00 | 8.00 | 10.00 |
| Getting out of bed | 9.60 | 9.20 | 10.00 |
| Completing homework | 9.68 | 9.68 | 9.68 |
| Having coffee | 9.00 | 9.33 | 9.00 |
| Fleeing from meetings | 8.95 | 8.95 | 8.95 |
| Getting submitted paper accepted | 7.69 | 7.69 | 7.69 |
| Writing papers | 6.67 | 7.62 | 6.67 |
| Discreet napping | 5.65 | 7.83 | 5.65 |
| Supervising undergrad students | 3.33 | 3.33 | 3.33 |
NOTE: Ulwick normalizes the percentages to 10 instead of 100. I’m not sure why, but this sometimes leads to confusion as the first impulse is to normalize the 1-5 question scale to 10 (by multipliying by 2).
Interpreting the results
To interpret the OpScore results, data is usually plotted on a graph like this one:
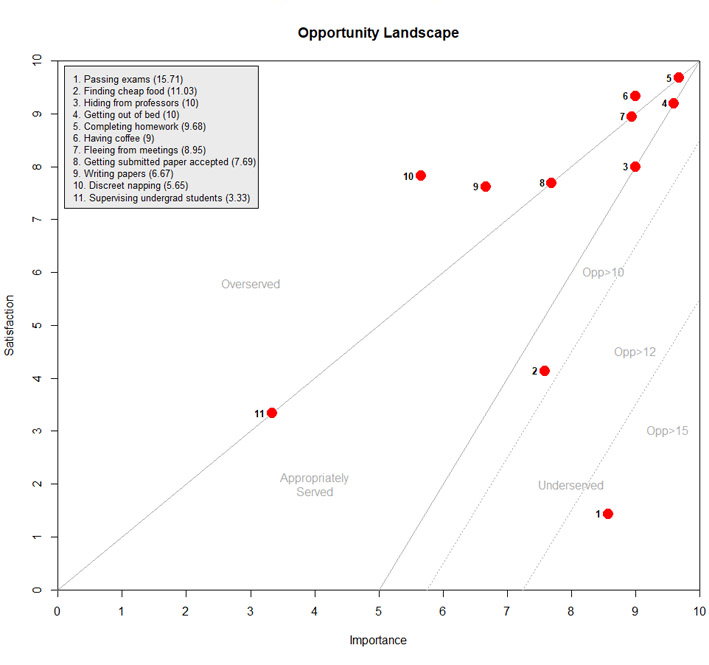 The Opportunity Landscape for "surviving grad school".
The graph illustrates how well customers’ needs are satisfied with current solutions. It helps to indicate prioritization strategies for improving existing products or creating new ones. The Overserved area suggests there is not much room for innovation and the way to compete there is mainly by offering a lower-priced solution. On the opposite side, the Underserved area indicates there are stronger opportunities to innovate as there are a lot of important unsatisfied needs. People will be willing to pay more to have these needs solved. The upper right corner area represents needs that are important but are currently well satisfied. Ulwick indicate thet these are “table stakes” that necessarily must be be served if one considers developing a competitive product.
Another interesting application of the opportunity score is for conducting competitive analysis. Breaking down features of two competing products (which are meant to lead to expected outcomes) and comparing their opportunity scores is a good way to compare how well they satisfy a customers’ job-to-be-done.
Ulwick also suggests conducting regression and clustering analyses to discover market segments with latent opportunities. This is out of the scope of this article (see the Further Reading section below for more information).
A word on sample sizes and other uses
For the type of market and innovation research that his original book aims for, Ulwick recommends asking the Importance and Satisfaction questions to a sample of at least 180 participants. To reach this sample sizes, a survey is probably the best method. At the DevDiv UX Research team we sometimes adapt Ulwick’s method when conducting Concept Value Testing (CVT) during 1 to 1 sessions with customers. In those cases, the OpScore allows us to get an idea of how critical a problem or ourcome is. Later on we present the features and conduct the actual CVT to assess whether the proposed solutions might help solving the problem or obtaining the desired outcome for the customer. In this kind of studies, sample sizes are usually lower (20+ participants), hence, although results can help guiding product development (e.g. for prioritizing engineering efforts), caution is needed before considering them significant.
R script
Here is an R script that will calculate the Opportunity Scores and generate an Opportunity map: OppScore: yet another R script for calculating opportunity scores and plotting the Opportunity Map / Landscape.
Further Reading
-
You can buy Ulwick’s original book from Amazon: “What Customers Want: Using Outcome-Driven Innovation to Create Breakthrough Products and Services”, by Anthony W. Ulwick.
-
Ulwick’s talk on ODI in the 2018 From Business to Buttons, a Scandinavian conference on UX and Service Design. Video.
-
Jobs-to-be-Done + ODI, a Medium blog by Ulwick. This is probably the most relevant post in that blog: Outcome-Driven Innovation: JTBD Theory in Practice
-
This article is a nice and short summary of the main topics in the book: Outcome-Driven Innovation