HaTS - Large-scale In-product Measurement of User Attitudes & Experiences with Happiness Tracking Surveys
Since the introduction of the world wide web, businesses have not only increased in number, but also in size, profit, and customer accessibility. Online and computer products have become ubiquitous and pervasive all across the world. Companies use this interconnectivity to monitor usage and adoption of their services and products. They even attempt to use this data to predict future usage and adoption. In the last twenty years, a variety of different survey techniques have emerged attempting to gauge customer satisfaction, likelihood to recommend, and attitudes towards products.
In this paper, Google presents a new method for collecting these customer sentiments through what they call a Happiness Tracking Survey (HaTS) to track customers’ attitudes of a product over time. They introduce a short questionnaire that’s initiated in a product after a customer completes a specific task. They use a series of questions to gauge a customer’s “happiness” with that product and give specific feedback.
“We refer to happiness as a set of metrics such as overall satisfaction, likelihood to recommend, perceived frustrations, and attitudes towards common product attributes, among others.”
Current In-product Survey Measures
Google’s HaTS survey evolved from a long line of previously validated survey methods. Each method attempts to capture customer reactions within the context of the product using a subset of questions. The authors argue that these surveys are too passive, and do not use random sampling to avoid bias towards customers dealing with a specific problem in the product.
Below are a few examples of in-product customer surveys:
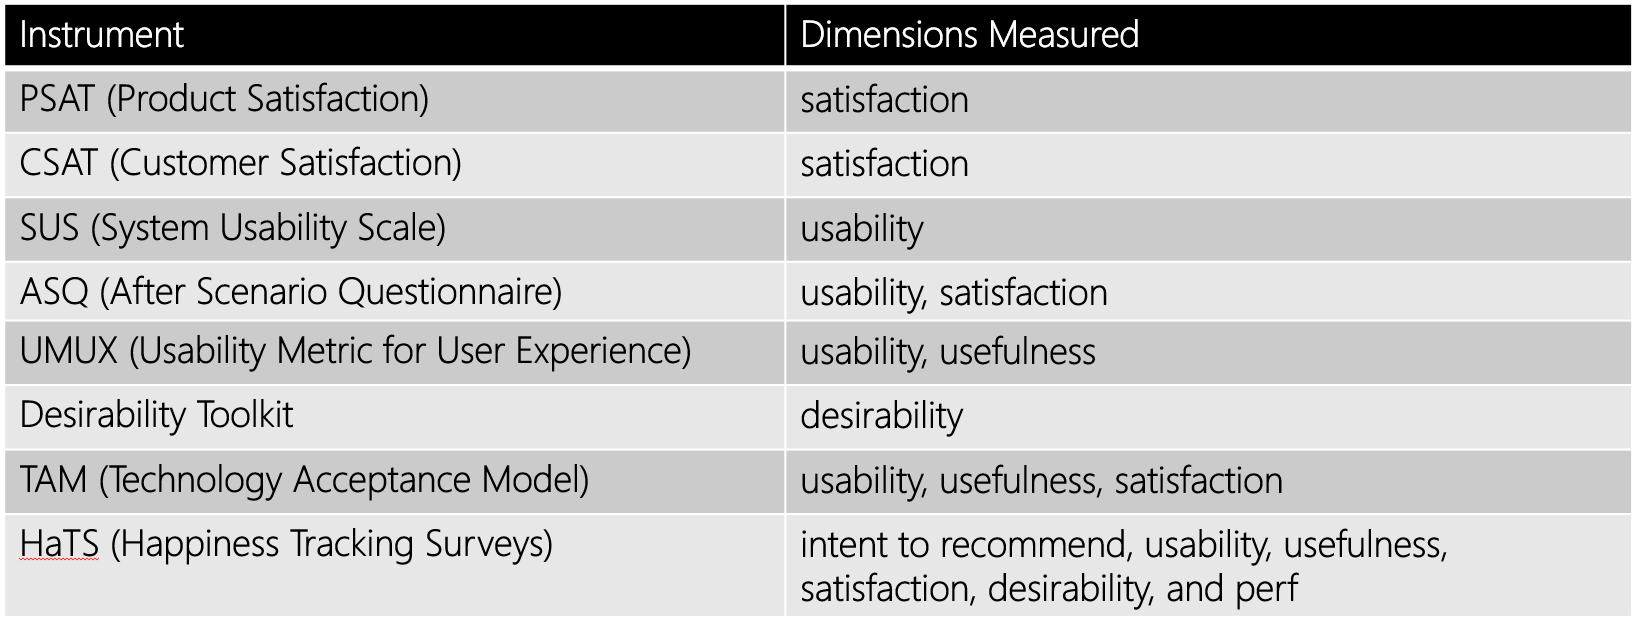
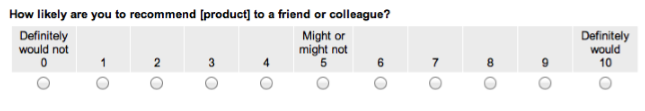
One of the most popular methods that a large majority of companies use is the Net Promoter Score (NPS), which gives the product a score based on customer’s likeliness to recommend that product or service to a friend. This score has become widely adopted because of its lightweight nature, being only one question on a 10-point scale that is easy for customers to understand. After responding to the Likert scale, they are given an open-ended? question to explain their answer so the product team can identify the areas of the product that reflect that person’s score. The overall score from all customer responses is then calculated based on promoters (greater than 8) and detractors (less than 7).
The NPS has many flaws, most importantly that it does not allow the product team to understand where the product is breaking down or succeeding, and track customer satisfaction when the product changes. This is where HaTS becomes a terrific tool.
What is HaTS?
HaTS is an in-product survey with a variety of questions aimed at collecting attitudinal data at a large scale directly in the product and over time. It elicits overall product perception, and some specific product area perceptions. This way the team can track customer perception of changes and improvements to the product and see if it is overall hurting or helping. No one likes change immediately, especially if you’ve become accustomed to a routine. So it’s important for a product team to monitor short-term effects of UI changes on users’ attitudes to see if change aversion is alleviated over time because customers eventually see the additional value from the change.
“[HaTS] attempts to enhance data validity by inviting people as they are using the product itself, therefore the responses directly reflect users’ attitudes and perceptions in context of their experiences with the actual product.”
Another goal of HaTS is to segment customers to identify how different subsets of the user base use and perceive the product. This allows the team to follow up with certain customers to figure out their frustrations and intentions when using the product and why that varies from other types of customers.
Google has tested this methodology thoroughly with various products, including Google Search, Gmail, Google Maps, Google Docs, and Google Drive. With HaTS, they tracked A/B tests and UI redesigns to see change aversion.
How is HaTS implemented?
HaTS uses best practices for questionnaire design including random sampling to get a representative sample and does not show up again for the same customer until 12 weeks have passed to avoid survey fatigue. The article suggests 400 to 1000 responses for a specific period of time to ensure 3-5% margins of error and 95% confidence. HaTS must be administered in the context of the experience to avoid poor recall, retrospective bias, and intermediary experience effects. Like NPS and other in product surveys, HaTS is initially displayed through a banner or link, rather than a modal, to ensure the customer sees it but is not stopped mid-task.
HaTS follows a funnel approach, meaning the questions go from broad to specific, to avoid order effects. The first questions ask about the product as a whole and are important to build rapport with the respondent. The questionnaire then presents product specific questions, including asking them to rate attributes and give specific feedback on tasks. Rating scale questions are to remain unlabeled with numbers so respondents focus on the meaning of the answer options. Open-ended questions are added to allow for qualitative explanatory “why” data.
The questionnaire ends with specific segmentation questions.
Survey Questions
1. Overall Product Satisfaction and Likelihood to Recommend
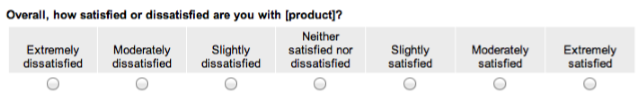
In order to gather customer’s overall attitudes towards the product, HaTS begins with an overall satisfaction question. This question is the only required question as it is the primary goal of HaTS and without it, the survey becomes irrelevant.
Even though there is skepticism with the reliability of NPS, Google included the likeliness to recommend question as an additional metric. However, they still believe that satisfaction can stand alone and provides enough insight into the customer’s overall product attitudes. This can be used to be correlated with the overall NPS if the product team is continuing to track it on top of HaTS.
2. Open-ended Frustrations and Areas of Appreciation
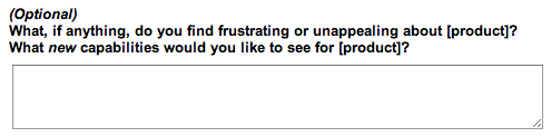
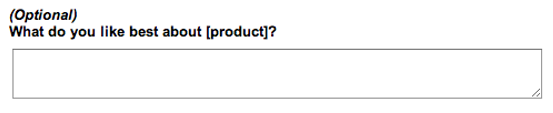
In order to dig into the satisfaction score, Google provides two qualitative open-ended questions. These aim to gather frustrations, missing capabilities, and favorite aspects of the product. They combine frustrations and missing capabilities because, through their experimentation, they found increased response quality when grouped rather than when asking two separate questions. Given HaTS also aims to give the product team direction on how to improve, the frustration question is asked first to allow customers more thoughtful time to respond. They however emphasize the importance to have customers highlight their favorite aspects so the team can ensure these remain in the product.
These questions are optional to ensure customers don’t perceive the questions to be too much effort and drop off. Through their experiments, doing so made the response quality increase.
3. Satisfaction with Common Attributes and Product-specific Tasks
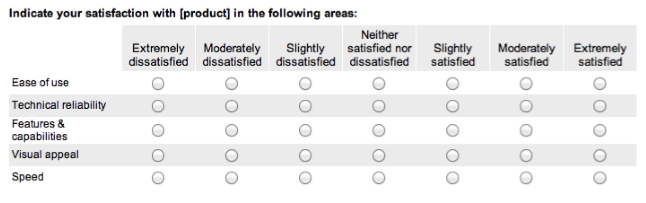
Continuing down the funnel, HaTS asks a matrix rating question focusing on different attributes of the user experience. These included perceived “ease of use,” “technical reliability,” “visual appeal,” and “speed.” Tracking these attributes allows the team to pinpoint aspects of the user experience affecting the satisfaction with the overall product. The team can also see if change aversion is caused by one of the specific attributes after say a new UI design or feature is released to customers.
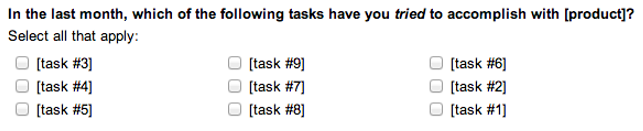
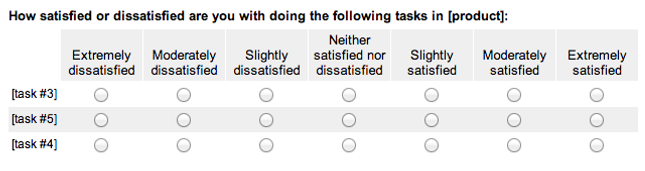
Next, HaTS focuses getting feedback on specific tasks that the customer has completed in the last month. The tasks selected in the first question are automatically populated in the follow up satisfaction question. This allows the team to hone in on specific areas of the product that may be affecting the customer’s perception and satisfaction of the product.
4. Respondent Characteristics and Ad-Hoc Questions
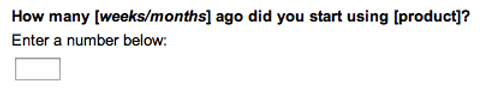
Finally, self-reported characteristics questions are added at the end to allow the team to segment their customers based on experience, background, etc. The last questions of HaTS are also home to ad-hoc questions the team can insert for short periods of time to allow for trend analysis.
TL:DR;
HaTS is a powerful tool to allow product teams to more closely monitor their product’s perception on user experience. With its ability to be implemented in-product and in context of the customer’s workflow, the team can receive reliable insights on particular areas of the product and monitor changes to ensure they are the right ones.
HaTS allows product teams to…
- Collect attitudinal data at a large scale directly in the product over time
- Measures usability, usefulness, satisfaction, desirability, and performance, as well as intent to recommend
- Characterize products’ user bases
- Monitor short-term effects of UI changes on users’ attitudes (change aversion)